







Gold Price Consolidates Near Recent Lows as Traders Assess Economic Data
The gold price traded in a tight range between $4,125 and $4,138 per troy ounce on Thursday. Spot gold held near a one-week low after several sessions of declines. Market activity remained subdued as participants weighed fresh economic releases against elevated energy costs and upcoming central bank decisions.
Global bullion markets showed fragile stabilization. Institutional flows balanced inflation signals from the energy sector with expectations around interest rate policy. The metal’s recent path reflects these competing pressures.
Key Takeaways:
- Gold trades in a tight range between $4,125–$4,138 per troy ounce, stabilizing near a one-week low after recent declines.
- Economic data impacts sentiment, with traders balancing inflation signals, energy costs, and central bank rate expectations.
- Energy prices remain elevated, supporting gold as a hedge against inflation but creating mixed market dynamics.
- Rising U.S. Treasury yields and a strong dollar pressure gold prices by increasing the opportunity cost of holding the metal.
- Gold remains down 4.9% year-to-date but has gained over 130% in five years, reflecting its long-term appeal despite short-term volatility.
Recent Price Action in XAU/USD
Gold has moved lower over the past several weeks. The four-hour chart displays a clear sequence of lower highs and lower lows from levels above $4,400 earlier in the period. Price recently tested areas near $4,080 before recovering modestly.
Intraday trading on Thursday stayed range-bound. Volume remained light ahead of next week’s Federal Open Market Committee meeting. The gold price currently sits well below its peaks from earlier in the year while remaining substantially higher than levels recorded five years ago.

Performance metrics underline the recent softness. Gold shows a decline of roughly 0.56 percent on the day and about 1.54 percent over five days. The one-month change stands near minus 5.8 percent. Year-to-date the metal is down approximately 4.9 percent, yet the five-year gain exceeds 130 percent.
Economic Calendar Releases Shape Sentiment
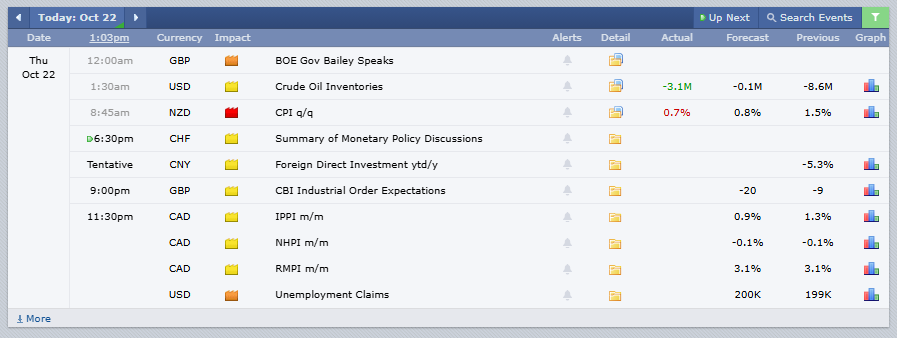
Thursday’s economic calendar featured several data points with potential relevance for risk assets and currencies. U.S. crude oil inventories fell by 3.1 million barrels. This draw exceeded the forecasted decline of 0.1 million barrels and followed a previous drop of 8.6 million barrels. The larger-than-expected reduction supported energy prices.
New Zealand quarterly consumer price inflation rose 0.7 percent. The figure came in below the 0.8 percent forecast and well under the prior 1.5 percent reading. Softer inflation data can influence expectations for monetary policy in that region.
Bank of England Governor Andrew Bailey is scheduled to speak. Markets will monitor any comments on the UK growth and inflation outlook. Additional releases include the Swiss National Bank’s summary of monetary policy discussions, Chinese foreign direct investment figures, UK CBI industrial order expectations, and Canadian industrial product, new housing, and raw materials price indexes. U.S. unemployment claims data is also due, with the forecast at 200,000 against a previous 199,000.
These releases contribute to the broader assessment of global growth and inflation trajectories. Traders continue to focus on how the data interact with energy market developments.
Energy Costs and Inflation Considerations
Brent crude oil has held near $110 per barrel. Light crude has traded around $98 per barrel with a daily gain of about 1.2 percent. Elevated energy prices sustain concerns about input costs across economies.
High oil levels traditionally support the case for physical assets that can act as hedges against purchasing-power erosion. At the same time, persistent energy inflation can reinforce expectations that central banks will keep policy rates higher for longer. This dynamic creates a mixed backdrop for gold.
Interest Rates, Yields, and the Dollar
U.S. Treasury yields remain elevated. The 10-year yield closed near 5.15 percent in the most recent session. Higher nominal and real yields increase the opportunity cost of holding non-interest-bearing assets such as gold.
The U.S. dollar index has traded around 101.7. A firm dollar tends to pressure gold because the metal is priced in dollars for most international buyers. Strength in the greenback raises the cost of gold for holders of other currencies.
Markets continue to price a high probability of a December rate adjustment by the Federal Reserve even as next week’s meeting is widely expected to result in a pause. This interest-rate outlook has limited upside momentum for the gold price in recent sessions.
Structural Drivers of Gold Price Dynamics
Several longer-term factors continue to influence the gold market. Real yields affect capital allocation between bonds and commodities. When real yields rise, liquidity often shifts toward interest-bearing securities. Current policy expectations have kept many multi-asset managers cautious on tactical gold exposure.
Currency dynamics form another pillar. Gold frequently moves inversely to the U.S. dollar. Sustained dollar strength therefore acts as a near-term headwind for the metal.
Energy and input-cost hedging remain relevant. Bullion has historically attracted demand during periods of geopolitical or supply-chain stress that lift oil and other commodities. Current energy prices inject an underlying supportive bid even as paper-market flows remain mixed.
Central bank and sovereign reserve activity provides a structural floor. Diversification away from single-currency reserves by various official institutions has supported physical demand in recent years. This buying has helped cushion deeper sell-offs in the futures and over-the-counter markets.
Technical Reference Levels
Market participants continue to monitor the $4,100 zone as an important near-term reference. A decisive move below that area would open the possibility of further testing toward the $3,925 to $3,950 region. On the upside, sustained strength above $4,180 to $4,200 would be required to signal a clearer shift in short-term momentum.
These levels serve as observational benchmarks rather than predictive targets. Price action around them will depend on the evolving macroeconomic data flow and shifts in real yields and the dollar.
Market Context and Broader Commodity Performance
Other precious metals have also faced pressure. Silver has declined more sharply than gold on both short-term and year-to-date measures. Platinum shows similar weakness. Industrial metals such as copper display mixed results, with recent declines but positive longer-term gains. Natural gas has been particularly soft over five days and year-to-date.
The divergence between energy strength and precious-metal softness highlights the nuanced environment. Inflation concerns from oil coexist with higher opportunity costs from elevated yields and a firm dollar.
For market participants seeking clearer insight into currency pairs and commodity relationships, Forex Trading Basics offers structured explanations of core concepts. Clients of Fortune Prime Global access deep liquidity across metals and forex markets together with educational resources that support informed analysis.
Outlook Remains Data-Dependent
The gold price enters the final stretch of the week in a consolidation phase near recent lows. Traders will continue to assess the remaining economic calendar items, any commentary from central bank officials, and movements in Treasury yields and the dollar. Next week’s Federal Reserve decision will provide the next major policy checkpoint.
In summary, spot gold has stabilized in a narrow band after a multi-week retreat. Mixed economic data, firm energy prices, elevated yields, and a resilient dollar have combined to limit directional conviction. The metal’s path from here will depend on how these factors evolve in the sessions ahead.
People Also Ask:
1. Why are gold prices consolidating near recent lows?
Gold prices are consolidating due to mixed market signals, including elevated energy costs, economic data releases, and expectations of central bank rate decisions.
2. How do energy prices affect gold prices?
High energy prices increase inflation concerns, which can boost demand for gold as an inflation hedge. However, they also contribute to expectations of prolonged high interest rates, which can pressure gold prices.
3. How do rising Treasury yields impact gold?
Rising Treasury yields increase the opportunity cost of holding non-interest-bearing assets like gold, leading to downward pressure on its price.
4. What role does the U.S. dollar play in gold pricing?
Gold is priced in U.S. dollars globally, so a strong dollar makes gold more expensive for buyers using other currencies, typically reducing demand and pressuring prices.
5. Is gold still a good long-term investment?
Despite short-term declines (down 4.9% year-to-date), gold has gained over 130% in five years, underscoring its value as a long-term investment and hedge against economic uncertainty.