
FPG AUDUSD Market Report August 18, 2026
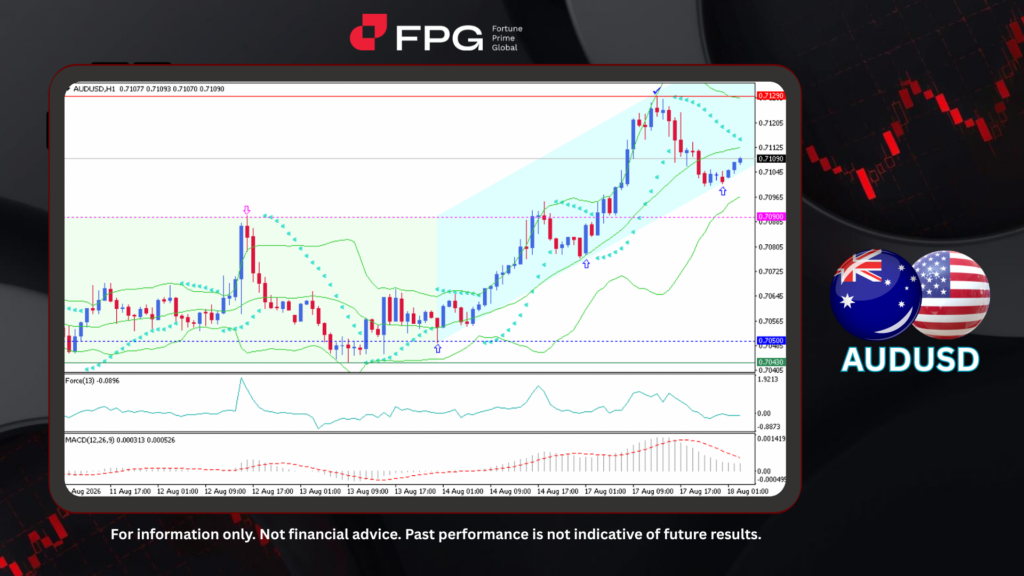
On the H1 timeframe, AUDUSD is trading within an ascending bullish channel following a previous period of sideways consolidation. As shown on the chart, the pair initially ranged between 0.7043 and 0.7090 before a bullish rally emerged from around 0.7050. The upward momentum strengthened steadily, establishing an ascending channel and driving the price to a recent peak near 0.7129. The current price is around 0.7109, with AUDUSD continuing to trade within the ascending channel despite the recent pullback.
The Bollinger Bands are beginning to narrow, indicating that volatility is gradually decreasing as price consolidates within the channel. Meanwhile, the Parabolic SAR dots remain above the candles, suggesting that short-term bearish pressure persists following the recent decline from the 0.7129 peak. The Force Index has also weakened and is currently slightly negative, reflecting a moderation in buying momentum. At the same time, the MACD remains in positive territory, although the declining histogram indicates that bullish momentum has softened in the near term.
Australia’s RBA has maintained a hawkish bias, keeping the possibility of further tightening alive as inflation remains elevated. Meanwhile, softer US economic data has reduced expectations for near-term Fed tightening, placing additional pressure on the US dollar. This policy divergence continues to provide support for the Australian dollar and AUDUSD. Overall, the fundamental backdrop remains supportive, while the technical structure indicates that AUDUSD is bullish within an ascending channel.
Technical Market Overview
1. Current Position: AUDUSD is currently trading around 0.7109 within an ascending bullish channel on the H1 timeframe. Despite a recent pullback from the 0.7129 peak, the pair remains within the broader bullish structure.
2. Resistance Zone: The immediate resistance zone is around 0.7129, which represents the recent peak. A sustained break above this level could signal further upside and reinforce the current bullish trend.
3. Support Zone: The nearest support is around 0.7090, and the lower boundary of the ascending channel. A break below this area could weaken the current bullish structure and increase the risk of a deeper correction.
4. Indicator Observation: The narrowing Bollinger Bands indicate decreasing volatility, while the Parabolic SAR remains above the candles, reflecting short-term bearish pressure. The Force Index is slightly negative, suggesting weaker buying momentum, while the MACD remains in positive territory despite a declining histogram.
5. Technical Summary: AUDUSD maintains a bullish technical structure while trading within an ascending channel. However, weakening momentum and short-term bearish signals suggest that the pair may undergo further consolidation or correction before potentially resuming its upward movement.
Market Performance:
Forex Last Price % Change
EUR/USD 1.1581 +0.01%
USD/JPY 159.40 −0.02%
Key Economic Calendar:
US: Net Long-term TIC Flows
AU: Westpac Consumer Confidence Change & Index
UK: Average Earnings incl. Bonus (3Mo/Yr)
UK: Employment Change
UK: Unemployment Rate
EU: ZEW Economic Sentiment Index
DE: ZEW Economic Sentiment Index
US: ADP Employment Change Weekly
CA: Housing Starts
US: Building Permits MoM & Building Permits (Preliminary)
US: Export & Import Prices MoM
US: Housing Starts MoM
US: Industrial Production MoM
US: Pending Home Sales MoM & YoY
Risk Disclaimer: This report is for informational purposes only and does not constitute financial advice. All investments involve risk and past performance is no guarantee of future results. Please consult your financial advisor for personalized investment advice.
