
FPG AUDUSD Market Report June 29, 2026
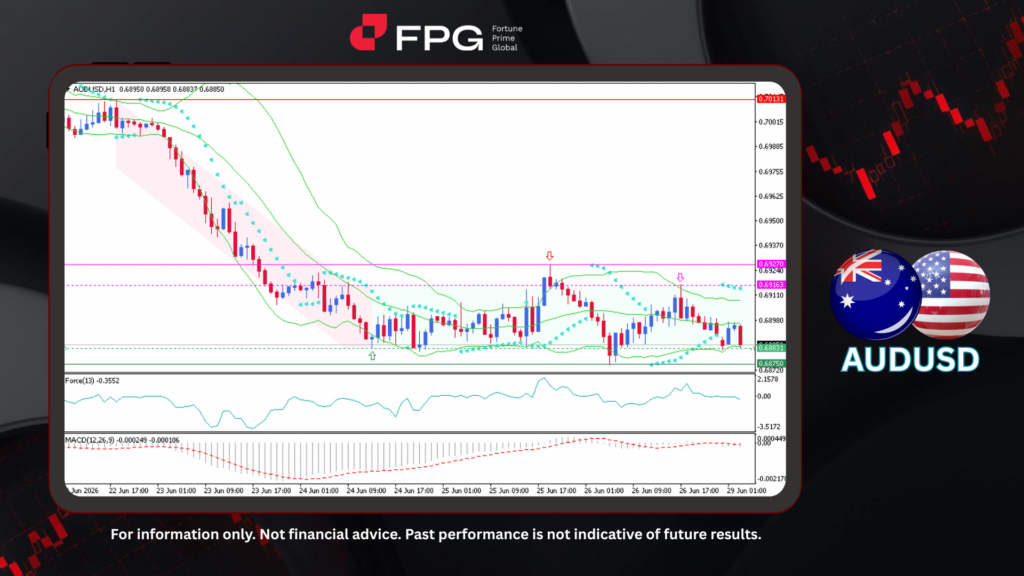
On the H1 timeframe chart, AUDUSD remains within a consolidation phase after previously experiencing a strong bearish decline from 0.7013 to 0.6883. Following the prolonged downtrend, price has stabilized and is currently moving within the 0.6883–0.6916 range, with additional support at 0.6875 and resistance at 0.6927. The latest price is trading around 0.6885, positioned very close to the lower boundary of the consolidation range, indicating that bearish pressure still dominates despite the absence of a fresh directional breakout.
From a technical perspective, AUDUSD continues to reflect a neutral-to-bearish market structure while remaining inside its sideways range. Price is currently trading near the lower Bollinger Band, suggesting that selling pressure remains active as volatility stays relatively contained. The Parabolic SAR dots remain positioned above the candles, confirming that the prevailing short-term trend is still bearish. Meanwhile, the Force Index (13) remains negative at approximately -0.3552, indicating that buying momentum remains weak, while the MACD (12,26,9) continues below the zero line at around -0.000249 and -0.000106, suggesting that bearish momentum persists despite gradually stabilizing price action. Overall, the indicators continue to favor sellers unless price manages to regain the upper boundary of the current consolidation range.
Global economic sentiment remains focused on fiscal policy adjustments, government debt levels, and budget sustainability as major economies balance growth support with financial stability. Investors are monitoring government spending, fiscal deficits, trade policies, and inflation pressures, which may influence future central bank decisions. Ongoing geopolitical risks and mixed economic signals are keeping currency markets cautious, contributing to AUDUSD remaining within a sideways range. Traders are advised to closely monitor today’s key economic releases, as these events often trigger significant price movements and increased market volatility.
Technical Market Overview
1. Current Position: AUDUSD is currently trading around 0.6885, remaining close to the lower boundary of its sideways consolidation range. Price continues to hold above the 0.6883 support area, although bearish pressure remains dominant.
2. Resistance Zone: The nearest resistance is located around 0.6916, followed by the stronger resistance at 0.6927. A sustained breakout above these levels could signal the beginning of a broader bullish recovery.
3. Support Zone: Immediate support is located at 0.6883, with stronger support positioned at 0.6875. A decisive break below 0.6875 could resume the broader bearish trend and expose lower price levels.
4. Indicator Observation: Price remains near the lower Bollinger Band while the Parabolic SAR dots continue to stay above the candles, maintaining the prevailing bearish bias. The Force Index (13) remains in negative territory at approximately -0.3552, while the MACD (12,26,9) stays below the zero line at approximately -0.000249 and -0.000106, indicating that bearish momentum is still present despite the ongoing consolidation.
5. Technical Summary: AUDUSD remains in a sideways consolidation within a broader bearish trend after its previous sharp decline. Buyers need to reclaim the 0.6916–0.6927 resistance zone to improve the short-term outlook, while a breakdown below 0.6883 and 0.6875 could trigger another wave of selling pressure.
Market Performance:
Forex Last Price % Change
EUR/USD 1.1386 +0.01%
USD/JPY 161.75 +0.04%
Key Economic Calendar:
JP: Retail Sales YoY
EU: ECB Forum on Central Banking
JP: Housing Starts YoY
UK: BoE Consumer Credit
UK: Mortgage Approvals & Lending
EU: Economic Sentiment
AU: RBA Kent Speech
US: Dallas Fed Manufacturing Index
Risk Disclaimer: This report is for informational purposes only and does not constitute financial advice. All investments involve risk and past performance is no guarantee of future results. Please consult your financial advisor for personalized investment advice.
