
FPG TSLA Market Report October 13, 2026
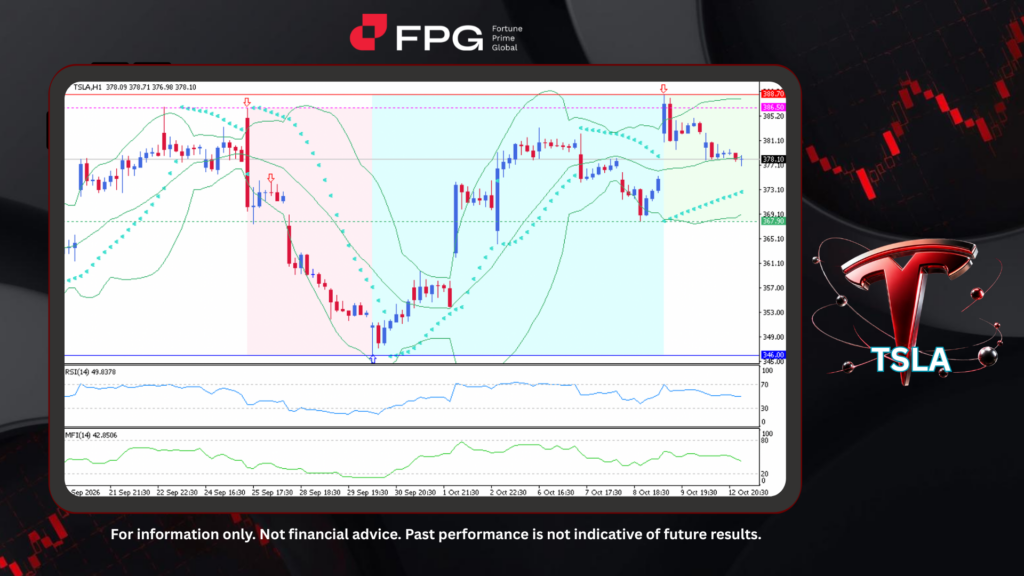
On the H1 chart, TSLA has shifted from a sharp bearish rally into a strong bullish recovery and is now entering a consolidation phase. Price fell from 386.50 to a low of 346.00, then rebounded and reversed into a bullish rally that reached a high of 388.70. After being rejected at that resistance, TSLA is now trading near 378.10, pulling back but still holding above key support at 367.90.
Technical indicators support this consolidation outlook. The Bollinger Bands remain relatively wide, showing that volatility has not yet fully contracted, while price is hovering near the middle band instead of pressing the upper band. The Parabolic SAR dots remain below the candles, indicating that the short-term bias has not turned bearish. Meanwhile, the RSI (14) at 49.84 sits at the neutral midpoint, and the MFI (14) at 42.85 leans slightly weaker. Together, these readings point to balanced momentum, with neither buyers nor sellers in clear control.
Tesla’s market outlook remains shaped by electric vehicle demand, autonomous driving developments, and growing investment in AI and robotics. However, concerns over delivery growth, regulatory challenges, and profitability have added uncertainty ahead of the upcoming earnings report. These factors have tempered investor enthusiasm following the recent bullish rally, suggesting that TSLA may be consolidating as the market reassesses its growth prospects.
Technical Market Overview
1. Current Position: TSLA is trading around 378.10 on the H1 timeframe, pulling back after a rejection at the recent high. Price is consolidating near the middle Bollinger Band following the bearish rally from 386.50 to 346.00 and the bullish reversal that followed.
2. Resistance Zone: The key resistance sits at 386.50 to 388.70. The 388.70 high marks the latest rejection point, and a sustained break above it would be needed to confirm renewed bullish momentum.
3. Support Zone: The nearest support is at 367.90, where price previously found buyers. A break below this level would expose the major support at 346.00, the low of the earlier bearish rally.
4. Indicator Observation: The Bollinger Bands remain relatively wide, showing that volatility has not yet fully contracted. The Parabolic SAR dots are still below the candles, so the short-term bias has not turned bearish. The RSI (14) at 49.84 is at the neutral midpoint, and the MFI (14) at 42.85 leans slightly weaker, indicating balanced momentum with no clear control from buyers or sellers.
5. Technical Summary: TSLA is consolidating between 367.90 and 388.70 after a strong bullish recovery. As long as price holds above 367.90, the broader structure remains constructive, but a clear breakout from this range is needed to confirm the next directional move. A move above 388.70 favors continuation to the upside, while a break below 367.90 would shift the bias toward a retest of 346.00.
Market Performance:
Stocks Last Price % Change
NVDA 226,32 −1,29%
NFLX 70,61 +0,44%
Key Economic Calendar:
UK: BRC Retail Sales Monitor YoY
AU: NAB Business Confidence
AU: RBA Meeting Minutes
US: Fed Waller Speech
US: ADP Employment Change Weekly
US: Existing Home Sales & Existing Home Sales MoM
Risk Disclaimer: This report is for informational purposes only and does not constitute financial advice. All investments involve risk and past performance is no guarantee of future results. Please consult your financial advisor for personalized investment advice.
