
FPG USDCAD Market Report June 1, 2026
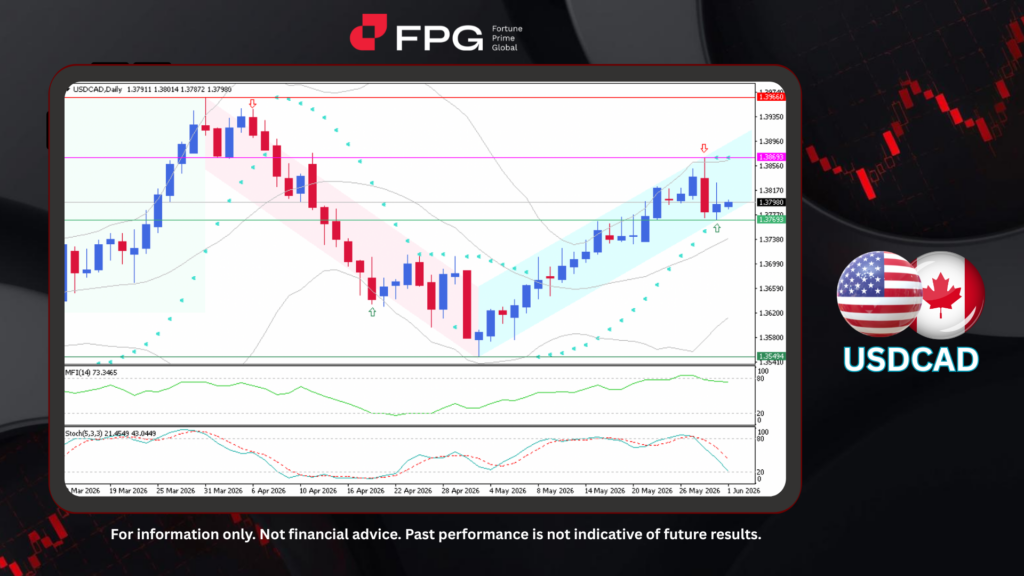
On the Daily timeframe chart, USDCAD is being observed from a broader long-term perspective. Previously, the pair experienced a relatively extended bearish rally, gradually declining from 1.3966 to 1.3549. From that support area, buying interest returned and successfully triggered a trend reversal, allowing price to establish a bullish recovery phase. Since rebounding from the low, USDCAD has consistently formed higher highs and higher lows while advancing within a well-defined ascending channel. The recent rally reached the 1.3869 resistance area before encountering selling pressure, causing a modest pullback. The current price is trading around 1.3798 and remains within the ascending channel structure. However, price is currently positioned closer to the lower half of the channel following the recent correction, suggesting that while the broader trend remains bullish, upside momentum has started to moderate.
From a technical perspective, USDCAD continues to maintain a constructive bullish structure despite the recent pullback from resistance. Price remains above the middle Bollinger Band and continues to trade within the broader ascending channel, indicating that buyers still retain control of the longer-term trend. Bollinger Bands remain moderately expanded, reflecting healthy volatility conditions associated with a sustained trending market. The Money Flow Index (14) is currently around 73.35, indicating that capital inflows remain relatively strong and that bullish sentiment continues to dominate, although the indicator is approaching elevated territory where momentum often begins to stabilize. Meanwhile, the Stochastic Oscillator (5,3,3) is currently around 21.45 and 43.04 after declining sharply from previously overbought conditions. This suggests that the recent correction has eased excessive bullish momentum and may allow the market to build a stronger base before its next directional move. Overall, technical indicators continue to support the broader bullish outlook, although short-term consolidation or corrective movement remains possible.
Recent market attention has been centered on U.S. trade and fiscal policies, Federal Reserve inflation concerns, resilient U.S. economic activity, softer Canadian growth data, Bank of Canada policy expectations, improving manufacturing sentiment across several major economies, and evolving global growth forecasts. Overall, these developments continue to favor the U.S. dollar, as the U.S. economy remains relatively stronger while Canada faces a more challenging growth environment. This backdrop has helped support the recent and relatively consistent appreciation of USDCAD. However, traders should remain cautious, as the pair can react sharply to major economic releases, central bank commentary, inflation reports, employment data, and PMI figures.
Technical Market Overview
1. Current Position: USDCAD is currently trading around 1.3798 after recently pulling back from the 1.3869 resistance area. Despite this correction, price remains inside a well-defined ascending channel, preserving the broader bullish structure.
2. Resistance Zone: Immediate resistance is located at 1.3869, which represents the recent swing high and a key barrier for bullish continuation. A stronger resistance zone is seen at 1.3966, representing the major peak from March and an important long-term resistance level.
3. Support Zone: Nearest support is identified at 1.3769, which aligns with the lower portion of the current ascending channel and recent pullback support. A deeper support zone lies around 1.3549, representing the major reversal low that initiated the current bullish trend.
4. Indicator Observation: Technical indicators continue to support a bullish long-term outlook despite recent momentum cooling. Bollinger Bands remain moderately expanded, reflecting healthy trending conditions. The Money Flow Index (14) remains elevated around 73.35, indicating that capital inflows and bullish sentiment are still relatively strong. Meanwhile, the Stochastic Oscillator (5,3,3) has retreated to 21.45 and 43.04, suggesting that the recent correction has reduced overbought conditions and may help stabilize the market before the next directional move.
5. Technical Summary: Overall, USDCAD remains in a bullish long-term trend, supported by its ascending channel structure and positive capital flow conditions. While the recent rejection from 1.3869 has introduced some short-term weakness, the broader trend remains constructive as long as price holds above key support levels. A successful break above 1.3869 would reinforce bullish continuation toward higher resistance zones, while a sustained move below 1.3769 could trigger a deeper correction within the broader uptrend.
Market Performance:
Forex Last Price % Change
EUR/USD 1.1652 −0.09%
USD/JPY 159.39 +0.10%
Today’s Key Economic Calendar:
JP: Capital Spending YoY
CN: RD Manufacturing PMI
UK: Nationwide Housing Prices MoM & YoY
EU: Unemployment Rate
CA: S&P Global Manufacturing PMI
US: ISM Manufacturing Employment
US: ISM Manufacturing PMI
Risk Disclaimer: This report is for informational purposes only and does not constitute financial advice. All investments involve risk and past performance is no guarantee of future results. Please consult your financial advisor for personalized investment advice.
