
FPG USDCAD Market Report May 22, 2026
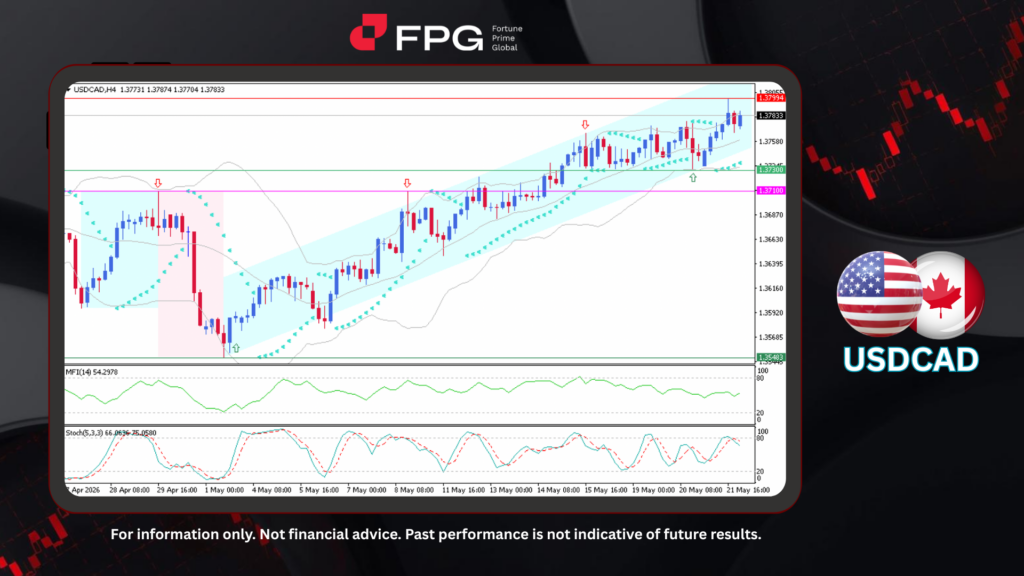
On the H4 timeframe chart, USDCAD continues to maintain a strong bullish structure, moving steadily within a well-defined ascending channel that has been developing since early May. The bullish rally initially started from the 1.3548 support base and continued gaining momentum after successfully breaking above the key 1.3710 resistance area. Following that breakout, price action accelerated further and eventually reached a recent high near 1.3799. Despite several short-term pullbacks during the rally, the overall market structure remains firmly bullish with higher highs and higher lows continuing to dominate the trend. The current price is trading around 1.3783, remaining near the upper boundary of the ascending channel while still showing stable bullish momentum.
From a technical perspective, USDCAD continues to trade above the middle Bollinger Band area, confirming that bullish momentum remains dominant despite temporary consolidation near the recent highs. Bollinger Bands are moderately expanded, reflecting sustained market volatility while still supporting the ongoing upward trend structure. The MFI (14) is currently around 54.29, indicating that buying pressure remains relatively balanced with no extreme overbought condition yet visible, although momentum has slightly moderated after the recent rally extension. Meanwhile, the Stochastic Oscillator (5,3,3) is currently around 66.06 and 75.05, showing that momentum remains in bullish territory despite beginning to flatten near the upper range, which may indicate slowing upside acceleration in the short term. Overall, technical indicators continue supporting the bullish outlook, although the market may enter temporary consolidation as momentum stabilizes near resistance.
Global markets continue to be influenced by geopolitical tensions, persistent inflation concerns, elevated oil prices, and uncertainty surrounding global trade policies. In the United States, resilient economic data and expectations that the Federal Reserve may keep interest rates higher for longer continue to support overall USD strength. Meanwhile, Canada faces softer economic momentum and trade-related uncertainty, although oil price movements still provide partial support for the Canadian Dollar. Overall, these conditions continue to support a stable bullish outlook for USDCAD, but traders are still advised to closely monitor upcoming key economic news and central bank developments.
Technical Market Overview
1. Current Position: USDCAD is currently trading around 1.3783 near the upper boundary of the ascending channel after extending its bullish rally from the 1.3548 base area. Price action remains firmly bullish with higher highs and higher lows still dominating the broader structure.
2. Resistance Zone: Immediate resistance is located at 1.3799, representing the recent swing high and current short-term ceiling for bullish continuation. A confirmed breakout above this area could open the path toward further upside expansion within the ascending channel structure.
3. Support Zone: Nearest support is identified at 1.3730, and a deeper support zone is located around 1.3710, representing a key previous resistance area that now acts as an important structural support level.
4. Indicator Observation: Technical indicators continue supporting bullish momentum despite signs of short-term stabilization. Bollinger Bands remain moderately expanded, reflecting active market volatility within the ongoing uptrend. The MFI (14) around 54.29 indicates relatively stable buying pressure without extreme overbought conditions, while the Stochastic Oscillator (5,3,3) at 66.06 and 75.05 remains in bullish territory but is beginning to flatten, suggesting slowing upside momentum near resistance.
5. Technical Summary: Overall, USDCAD maintains a strong bullish outlook as price continues moving within the ascending channel and remains supported by positive momentum indicators. However, with price currently trading near the recent highs and momentum indicators beginning to stabilize, the market may experience temporary consolidation or minor pullbacks before attempting further bullish continuation. A confirmed breakout above 1.3799 would reinforce the bullish trend, while failure to sustain momentum near resistance could trigger corrective movement toward nearby support zones.
Market Performance:
Forex Last Price % Change
EUR/USD 1.1613 −0.03%
USD/JPY 159.08 +0.10%
Today’s Key Economic Calendar:
UK: GfK Consumer Confidence
JP: Inflation Rate YoY
DE: GfK Consumer Confidence
UK: Retail Sales MoM & YoY
DE: Ifo Business Climate
CN: FDI (YTD) YoY
EU: Negotiated Wage Growth
CA: Retail Sales Ex Autos MoM
CA: Retail Sales MoM Final & Preliminary
US: Michigan Consumer Sentiment Final
CA: Senior Loan Officer Survey
US: Fed Waller Speech
Risk Disclaimer: This report is for informational purposes only and does not constitute financial advice. All investments involve risk and past performance is no guarantee of future results. Please consult your financial advisor for personalized investment advice.
