
FPG USDCAD Market Report September 14, 2026
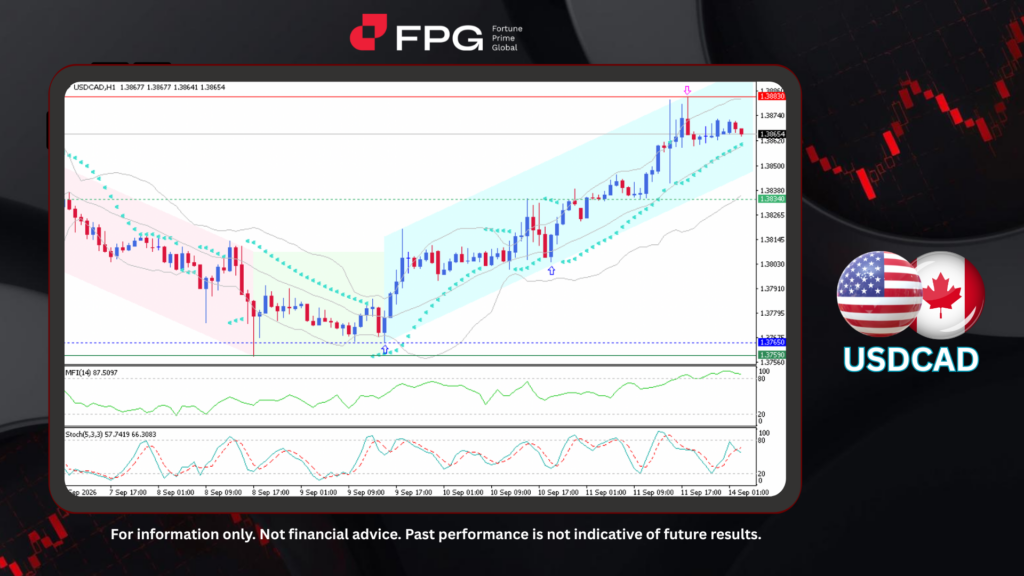
USDCAD continues to extend its bullish rally on the H1 timeframe, maintaining a well-defined ascending channel since the move began. Bullish momentum has been gaining strength steadily from the 1.3765 level, propelling price to a swing high of 1.3883, a level that aligns precisely with the upper boundary of the channel. Price currently trades near 1.3865, with volatility remaining elevated as the pair consolidates just below its recent peak.
Momentum indicators continue to support the bullish structure. The Bollinger Bands remain wide yet stable, reflecting sustained directional conviction rather than erratic price action, while the Parabolic SAR dots continue to trail below price, confirming that the underlying uptrend remains intact. The Money Flow Index is elevated above 87, indicating strong buying interest, though readings this high also warrant caution around the potential for a near-term pullback or consolidation phase. The Stochastic oscillator sits in the 58–66 range with %K holding above %D, pointing to a modest bullish bias that has yet to reach overbought extremes, suggesting some room remains for continuation before momentum signals a stretch.
The broader fundamental backdrop continues to favor further USD strength. Firmer US inflation data alongside elevated energy prices has reinforced expectations that the Federal Reserve will maintain a tighter policy stance for longer. On the Canadian side, renewed trade friction with the US has pressured the Canadian dollar and stoked concerns over the domestic growth outlook. Compounding this, ongoing geopolitical risks and rising oil prices have injected further uncertainty into global markets. Taken together, these dynamics have reinforced dollar demand and underpinned the pair’s consistent upward trajectory.
Technical Market Overview
1. Current Position: USDCAD is trading around 1.3865, holding firm within an established ascending channel after rallying from the 1.3765 base. Price remains in bullish territory, consolidating just below its recent high following an extended upward push.
2. Resistance Zone: The immediate resistance sits at 1.3883, marking the most recent swing high and coinciding with the upper boundary of the ascending channel. A break and sustained close above this level would open the path toward further upside extension.
3. Support Zone: Near-term support is located at 1.3834, a former resistance-turned-support level that has helped cushion pullbacks within the current uptrend. A deeper support zone sits at 1.3765–1.3759, corresponding to the origin of the recent bullish impulse; a break below this area would signal a potential shift in short-term structure.
4. Indicator Observation: The Bollinger Bands remain wide and stable, reflecting sustained directional momentum rather than range-bound conditions. The Parabolic SAR dots continue to trail below price action, confirming that the bullish trend remains intact. The MFI is elevated above 87, indicating strong buying flow but nearing overbought conditions that raise the risk of near-term consolidation. The Stochastic oscillator reads in the 58–66 range with %K above %D, supporting a mildly bullish bias while leaving room before reaching overbought extremes.
5. Technical Summary: USDCAD maintains a constructive bullish structure, supported by both trend and momentum indicators, with price holding within its ascending channel. As long as price holds above the 1.3834 support, the broader uptrend remains favored, with 1.3883 as the key resistance to watch. A breakout above this level could extend gains further, while a break below 1.3765 would warrant a reassessment of the short-term bullish bias.
Market Performance:
Forex Last Price % Change
EUR/USD 1.1592 −0.06%
GBP/USD 1.3525 −0.01%
Key Economic Calendar:
AU: RBA Hunter Speech
CN: New Yuan Loans
CA: Core Inflation Rate YoY
CA: Inflation Rate MoM & YoY
EU: ECB President Lagarde Speech
Risk Disclaimer: This report is for informational purposes only and does not constitute financial advice. All investments involve risk and past performance is no guarantee of future results. Please consult your financial advisor for personalized investment advice.
