
FPG USOUSD Market Report September 1, 2026
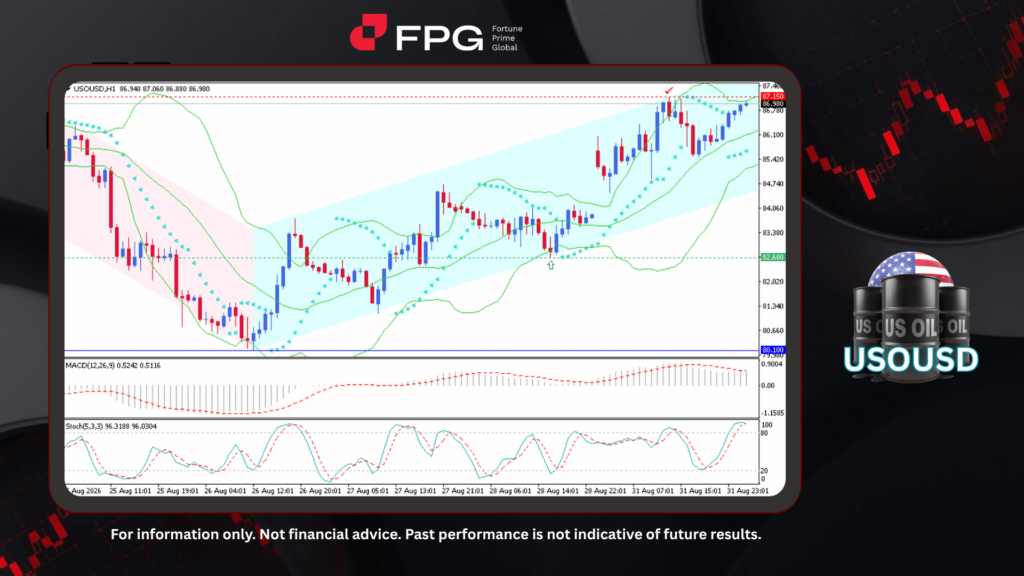
On the H1 chart, USOUSD has extended its bullish rally over the past week. Price action shows the previous downtrend giving way to a decisive reversal near the 80.10 level, followed by a steady and well-defined move within an ascending channel. The rally pushed price to a recent high of 87.15 before easing slightly, with USOUSD now trading around 86.98, hovering just below resistance while continuing to respect the upper boundary of the channel.
Momentum indicators suggest that the bullish structure remains intact, although early signs of slowing momentum are emerging. The Bollinger Bands have begun to narrow, indicating a gradual compression in volatility following the recent advance, while the Parabolic SAR dots remain below price, confirming that the underlying uptrend is still in place. The MACD remains above the zero line with the signal line maintaining a bullish alignment, although the histogram has started to contract, suggesting that upward momentum is moderating. Meanwhile, the Stochastic oscillator remains deep in overbought territory near 96, with the %K and %D lines closely converged. This configuration may increase the likelihood of a short-term pullback or consolidation before the broader bullish trend resumes.
From a fundamental perspective, crude oil continues to find support from persistent geopolitical risks. Renewed tensions in the Middle East, alongside ongoing uncertainty surrounding the Strait of Hormuz, have kept supply-side concerns firmly in focus. US crude inventories increased by just 95,000 barrels last week, significantly below market expectations, reinforcing expectations of relatively tight supply conditions. Meanwhile, escalating tensions between the US and Iran have further heightened concerns over potential disruptions to global energy flows and refining capacity. Taken together, these supply-side pressures continue to provide underlying support for oil prices, keeping USOUSD firmly bullish and within its ascending channel.
Technical Market Overview
1. Current Position: USOUSD is trading around 86.98, maintaining a firm bullish structure following its reversal from the 80.10 level. Price continues to advance within a well-defined ascending channel, remaining above both the moving average and the Bollinger Bands’ middle line.
2. Resistance Zone: Immediate resistance is positioned at 87.15, marking the recent swing high and the upper boundary of the ascending channel. A sustained break above this level would strengthen the bullish outlook and potentially open the way for further gains, while failure to break through could trigger a short-term pullback.
3. Support Zone: Initial support is located around 86.10–85.42, aligning with the middle Bollinger Band and previous consolidation area. A deeper support zone is found near 82.68, corresponding to the lower boundary of the ascending channel and a key structural level established earlier in the recent rally.
4. Indicator Observation: The Bollinger Bands are narrowing, signaling reduced volatility following the recent advance. The Parabolic SAR remains positioned below price, confirming that the bullish bias is still intact. The MACD continues to hold above the zero line with a positive histogram, although the contraction in the bars suggests that upward momentum is moderating. The Stochastic oscillator remains elevated near 96, deep in overbought territory, indicating that USOUSD may be vulnerable to a near-term corrective move.
5. Technical Summary: USOUSD remains structurally bullish, supported by a well-defined ascending channel and positive trend-following signals. However, the elevated Stochastic reading and narrowing Bollinger Bands suggest that the rally may enter a period of consolidation or experience a short-term pullback before potentially resuming higher. A sustained break above 87.15 would reinforce the bullish continuation scenario, while a pullback toward the 86.10–85.42 support region would remain consistent with a healthy retracement within the broader uptrend.
Market Performance:
Commodities Last Price % Change
UKOUSD 92.41 +0.26%
Key Economic Calendar:
JP: Capital Spending YoY
AU: Building Permits MoM
CN: RD Manufacturing PMI
JP: Consumer Confidence
UK: Nationwide Housing Prices MoM & YoY
DE: Retail Sales MoM & YoY
RU: S&P Global Manufacturing PMI
UK: BoE Consumer Credit
UK: Mortgage Approvals & Lending
EU: Core Inflation Rate YoY (Flash)
EU: Inflation Rate MoM & YoY (Flash)
EU: Unemployment Rate
US: Fed Barr Speech
CA: S&P Global Manufacturing PMI
US: ISM Manufacturing Employment & PMI
US: JOLTs Job Openings
Risk Disclaimer: This report is for informational purposes only and does not constitute financial advice. All investments involve risk and past performance is no guarantee of future results. Please consult your financial advisor for personalized investment advice.
