
FPG USOUSD Market Report September 9, 2026
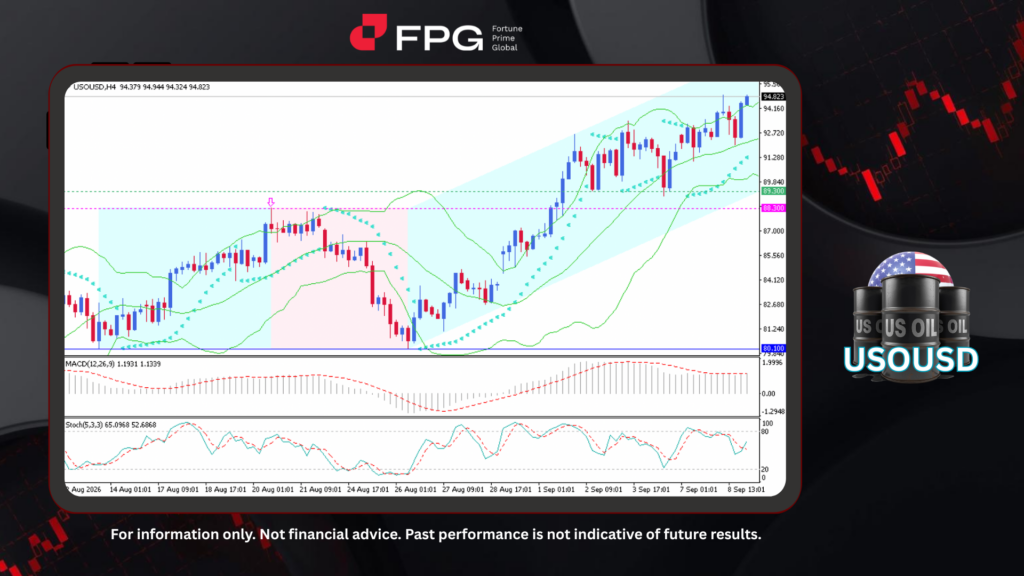
On the H4 timeframe, USOUSD continues to trade within a bullish structure that has now persisted for nearly two weeks. Following a rejection near 88.30, buyers regained control at 80.10, establishing the base from which the current uptrend developed. Since then, price has advanced steadily within a well-defined ascending channel, eventually breaking decisively above the 88.30 level. USOUSD is now trading around 94.82, with the 89.30 zone acting as nearby support and the psychological 96.00 level standing out as the next area of resistance.
Momentum indicators broadly support the continuation of this trend, although with early signs of moderation. The Bollinger Bands have narrowed slightly relative to the previous rally phase, pointing to a modest reduction in volatility even as price holds near the upper band. The Parabolic SAR dots remain positioned below price action, keeping the broader bullish bias intact. The MACD stays above the zero line with a positive histogram, though the bars have begun to contract from their recent highs, suggesting momentum is cooling slightly following the sharp move higher. Meanwhile, the Stochastic oscillator sits in neutral-to-bullish territory near the 65/53 range, with %K turning upward again after a brief pullback, leaving room for further upside before overbought conditions near 80 come into play.
The broader fundamental backdrop reinforces this technical picture. Over the past two weeks, oil markets have been underpinned by escalating US-Iran tensions, reported attacks on Saudi energy infrastructure, and growing concern over potential disruptions to crude flows through the Strait of Hormuz, factors that have driven WTI to its highest levels since early June. Additional support has come from OPEC+’s October production stance and a decline in US crude inventories, with unexpectedly large inventory draws further tightening the supply outlook. While softer Chinese demand and rising non-OPEC output continue to weigh on sentiment, geopolitical risk premiums have so far outweighed these bearish pressures. Against this backdrop, USOUSD’s two-week bullish trend appears well-supported, with ongoing supply-side risks and firm global energy market conditions likely to sustain upward pressure in the near term.
Technical Market Overview
1. Current Position: USOUSD is trading at 94.82 on the H4 timeframe, extending a bullish trend that has been in place for nearly two weeks. Price action remains contained within a well-defined ascending channel, with candles trading near the upper boundary of the channel, reflecting sustained buying pressure.
2. Resistance Zone: The nearest resistance stands at the 96.00 psychological level, which aligns with the upper boundary of the ascending channel. A sustained break above this zone would open the path toward further upside continuation.
3. Support Zone: Immediate support is located at 89.30, followed by a stronger structural support at 88.30, the level from which price broke out to resume its bullish advance. The 80.10 zone remains the origin of the current trend and serves as a deeper support in case of an extended pullback.
4. Indicator Observation: The Bollinger Bands have narrowed slightly compared to the previous rally phase, signaling a modest reduction in volatility. The Parabolic SAR dots remain below price, keeping the bullish bias intact. The MACD holds above the zero line with a positive histogram, though bars are contracting from recent highs, hinting at slightly softening momentum. The Stochastic oscillator sits near 65/53, with %K turning higher again, leaving room for further upside before reaching overbought conditions near 80.
5. Technical Summary: USOUSD remains structurally bullish, supported by an intact ascending channel and constructive indicator readings. While momentum shows early signs of moderation, the overall trend bias favors continuation toward the 96.00 resistance, provided support at 89.30–88.30 holds on any near-term pullback.
Market Performance:
Commodities Last Price % Change
UKOUSD 100.43 +0.13%
Key Economic Calendar:
CN: Inflation Rate MoM & YoY
CN: PPI YoY
US: MBA 30-Year Mortgage Rate
US: ADP Employment Change Weekly
Risk Disclaimer: This report is for informational purposes only and does not constitute financial advice. All investments involve risk and past performance is no guarantee of future results. Please consult your financial advisor for personalized investment advice.
