
FPG XAUUSD Market Report October 24, 2025
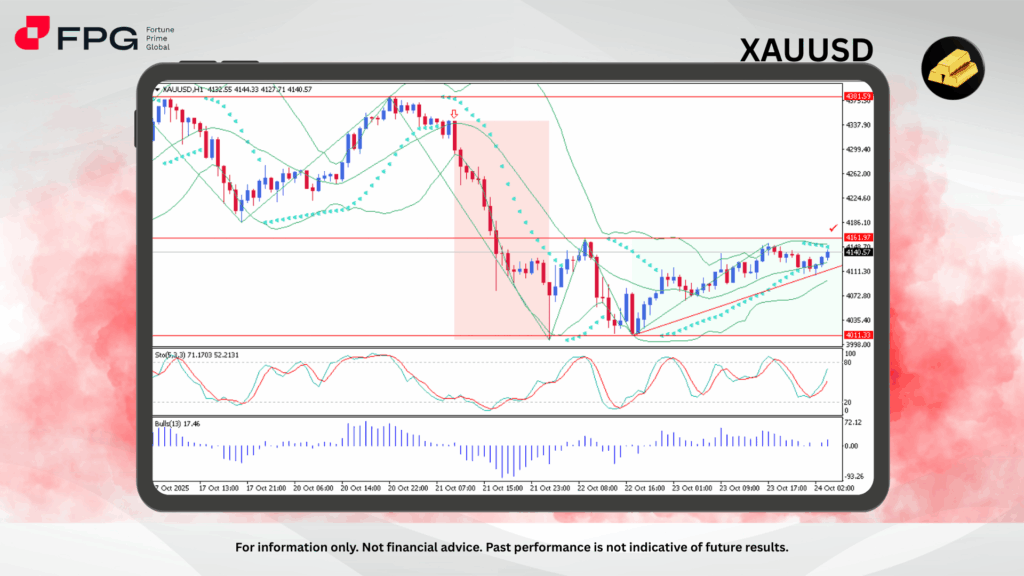
Gold’s current movement remains similar to yesterday, showing relative stability within a sideways trading channel. Price fluctuations appear calmer compared to the sharp volatility seen in recent weeks. The price continues to oscillate between 4011 and 4161, with a slightly bullish diagonal trendline emerging on the hourly chart. The current level is around 4140, and traders are advised to monitor price reactions closely near key levels, especially during major economic data releases or geopolitical developments.
From a technical standpoint, gold is still consolidating after the steep decline earlier this week. The price is moving near the middle of the Bollinger Bands and continues to be supported by a short-term ascending trendline, suggesting a mild recovery attempt. The Stochastic oscillator sits near the mid-level at 52, showing potential for a continued short-term upward push, while the Bulls Power indicator reads 17.46, reflecting limited bullish pressure. The Parabolic SAR remains below the price candles, confirming a still-valid short-term bullish bias, though resistance at 4161 could cap the upside unless strong momentum appears.
Fundamentally, gold’s price movement continues to be influenced by a tug-of-war between the U.S. Federal Reserve policy expectations and global risk sentiment. Hawkish Fed comments and stronger bond yields have kept upward moves in check, but safe-haven demand persists amid geopolitical tensions and uncertain economic outlooks in China and the Middle East. This dynamic has kept gold in a consolidative phase, as investors await clearer cues from upcoming U.S. economic data to determine whether the next major move will break above resistance or slide back toward support.
Market Observation & Strategy Advice
1. Current Position: Gold is trading around 4140, maintaining stability within a sideways channel. The market shows reduced volatility compared to previous sessions, indicating consolidation after a sharp decline. Short-term momentum leans slightly bullish, supported by a gradual upward diagonal trendline.
2. Resistance Zone: The nearest resistance is seen at 4161, where previous price rejections occurred. A breakout above this level may open the way toward 4200, signaling stronger bullish momentum.
3. Support Zone: Immediate support lies around 4011, a key psychological and technical area that has held firm in recent sessions. A breakdown below this level could trigger further downside toward the 3980 region.
4. Indicators: The Stochastic oscillator currently hovers around the mid-level, showing neutral momentum with potential for upward continuation. Bulls Power at 17.46 suggests mild buying strength, while the Parabolic SAR remains below price action, confirming a short-term bullish bias. Overall, indicators point to cautious optimism, with consolidation likely before a decisive move.
5. Trading Strategy Suggestions:
- Buy on Dips: Consider entering long positions near the 4110–4120 support area, targeting a potential rebound toward 4160–4170, in line with the current mild bullish bias.
- Range Play: If price remains capped below 4161, short-term traders may take advantage of range-bound movements, selling near resistance and buying near support.
- Breakout Watch: Monitor for a confirmed breakout — above 4161 could signal a bullish continuation toward 4200, while a drop below 4011 may indicate a deeper corrective phase.
Market Performance:
Precious Metals Last Price % Change
XPTUSD 1,584.52 +0.53%
XAGUSD 48.7780 −0.29%
Today’s Key Economic Calendar:
JP: Inflation Rate YoY
UK: Retail Sales MoM
DE: HCOB Manufacturing PMI Flash
UK: S&P Global Manufacturing & Services PMI Flash
US: Core Inflation Rate MoM & YoY
US: Inflation Rate MoM & YoY
Risk Disclaimer: This report is for informational purposes only and does not constitute financial advice. All investments involve risk and past performance is no guarantee of future results. Please consult your financial advisor for personalized investment advice.
