
FPG XAUUSD Market Report September 17, 2026
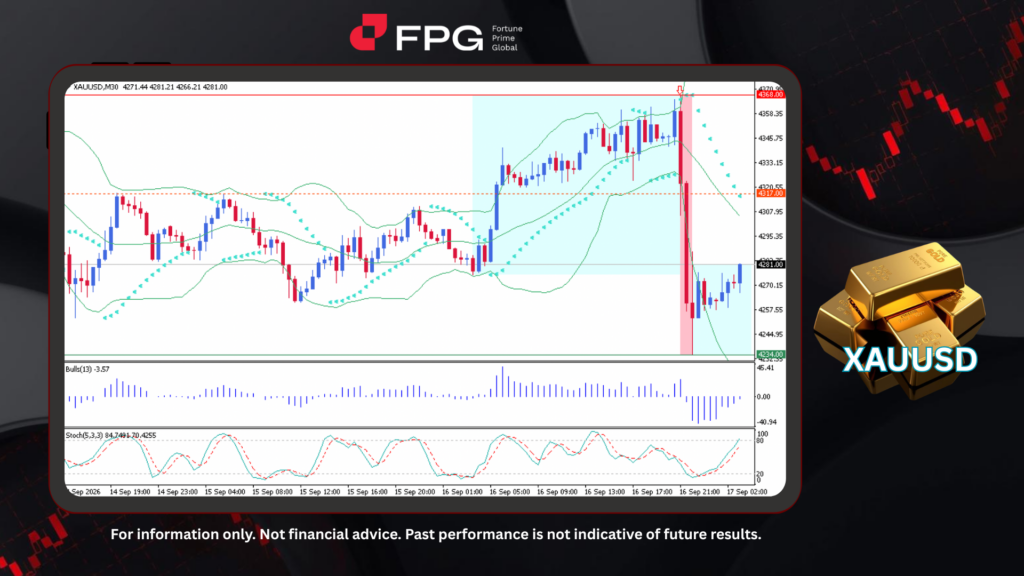
Gold has just experienced a sharp and aggressive move on the 30-minute chart, tumbling from a recent high of 4,368 to a low of 4,234. The move represents a decline of roughly 3%, with the bulk of the selling pressure unfolding within a remarkably short period, highlighting the intensity of the recent downward move and the elevated volatility surrounding gold prices. Price is currently trading near 4,281, with tentative signs of stabilization emerging after the sell-off. The nearest resistance level to watch sits at 4,317, and until that level is reclaimed, volatility is likely to remain elevated.
The technical picture reflects the intensity of the move. Bollinger Bands remain sharply expanded, a hallmark of the volatility spike that accompanied the drop, and have yet to contract meaningfully. The Parabolic SAR continues to print above price, keeping the short-term trend bias bearish, though the dots are beginning to close the distance as buyers step back in. Bulls Power, which surged ahead of the reversal, plunged deeply negative during the decline, clear evidence that sellers were firmly in control, but has since started curling back toward the zero line, hinting at fading downside pressure. The Stochastic oscillator, meanwhile, has rebounded from near the oversold threshold and is trending higher, pointing to building short-term momentum, though it has not yet reached overbought territory that would flag the bounce as overextended.
The catalyst behind the move was macro rather than technical. Within the past 24 hours, the Federal Reserve raised its benchmark rate by 25 basis points to a target range of 3.75%–4.00%, its first hike since July 2023, while signaling that inflation remains a key concern and further tightening could follow. The decision was accompanied by higher Treasury yields and a stronger US dollar, while elevated oil prices continued to reinforce inflation concerns, adding pressure to non-yielding assets such as gold. Spot gold reversed sharply, falling from above 4,365 to near 4,240 before finding a floor. For XAUUSD specifically, the combination of tighter Fed policy, dollar strength, and elevated yields provided a significant headwind, while the modest recovery suggests the market is now testing whether the move represents genuine stabilization or only a temporary pause.
Technical Market Overview
1. Current Position: Gold is trading near 4,281 after a sharp decline from 4,368, with early candles showing signs of stabilization. Momentum remains fragile as the market digests the recent volatility spike.
2. Resistance Zone: Immediate resistance sits at 4,317, with the prior high at 4,368 as the next key barrier. A sustained move above 4,317 would improve the short-term technical structure.
3. Support Zone: The nearest support lies at 4,234, aligning with the recent swing low. A break below this level would reinforce the current downside structure.
4. Indicator Observation: Bollinger Bands remain wide and Parabolic SAR sits above price, keeping the short-term bias bearish despite narrowing distance. Bulls Power is recovering from negative territory, while Stochastic is rising from oversold levels, indicating building but still unconfirmed upside momentum.
5. Technical Summary: Price is consolidating between key support and resistance following a high-volatility reversal, with the next directional move likely hinging on a break of either 4,317 or 4,234. Until then, elevated volatility remains the dominant technical characteristic.
Market Performance:
Precious Metals Last Price % Change
XPTUSD 1,762.99 +0.67%
XAGUSD 63.4000. +0.66%
Key Economic Calendar:
EU: ECB President Lagarde Speech
US: Fed Interest Rate Decision
US: FOMC Economic Projections
US: Fed Press Conference
US: Net Long-term TIC Flows
CN: FDI (YTD) YoY
UK: BoE Interest Rate Decision
UK: BoE MPC Vote (Cut, Hike & Unchanged)
UK: MPC Meeting Minutes
US: Building Permits MoM & Building Permits (Preliminary)
US: Housing Starts & Housing Starts MoM
US: Initial Jobless Claims
US: Philadelphia Fed Manufacturing Index
US: Pending Home Sales MoM & YoY
Risk Disclaimer: This report is for informational purposes only and does not constitute financial advice. All investments involve risk and past performance is no guarantee of future results. Please consult your financial advisor for personalized investment advice.
