


Support and Resistance (S&R) levels are among the most widely used tools in technical analysis, but knowing what they are isn’t enough—you also need to know how to identify them accurately on your charts. These levels help highlight where the market has historically reacted, paused, or changed direction, offering a clearer view of the dynamics between buyers and sellers.
In this lesson, we’ll explore practical methods for spotting S&R levels using historical data, psychological price zones, technical indicators, and volume confirmation. By the end, you’ll be able to identify strong S&R zones with confidence and understand why certain levels matter more than others.
Key Takeaways:
- Historical Price Action: Use past price movements to locate reliable support and resistance zones.
- Psychological Price Levels: Recognize key round numbers where markets often react, even without technical evidence.
- Dynamic Indicators: Tools like Moving Averages, Fibonacci Retracements, and Bollinger Bands reveal adaptable S&R levels.
- Volume Confirmation: High volume at a level confirms its strength and filters out false signals.
- Confluence: Combine multiple methods for more reliable S&R zones, improving market analysis accuracy.
1. Using Historical Price Action to Identify Key Levels
The most reliable S&R levels come from price history. Markets tend to react to certain price zones again and again, forming natural floors and ceilings.
How to spot them:
- Look for repeated reversals, consolidations, or “bounces” at similar price areas.
- Multiple touches strengthen the level, showing that market participants are paying attention.
- Draw horizontal lines across previous highs and lows to establish static S&R.
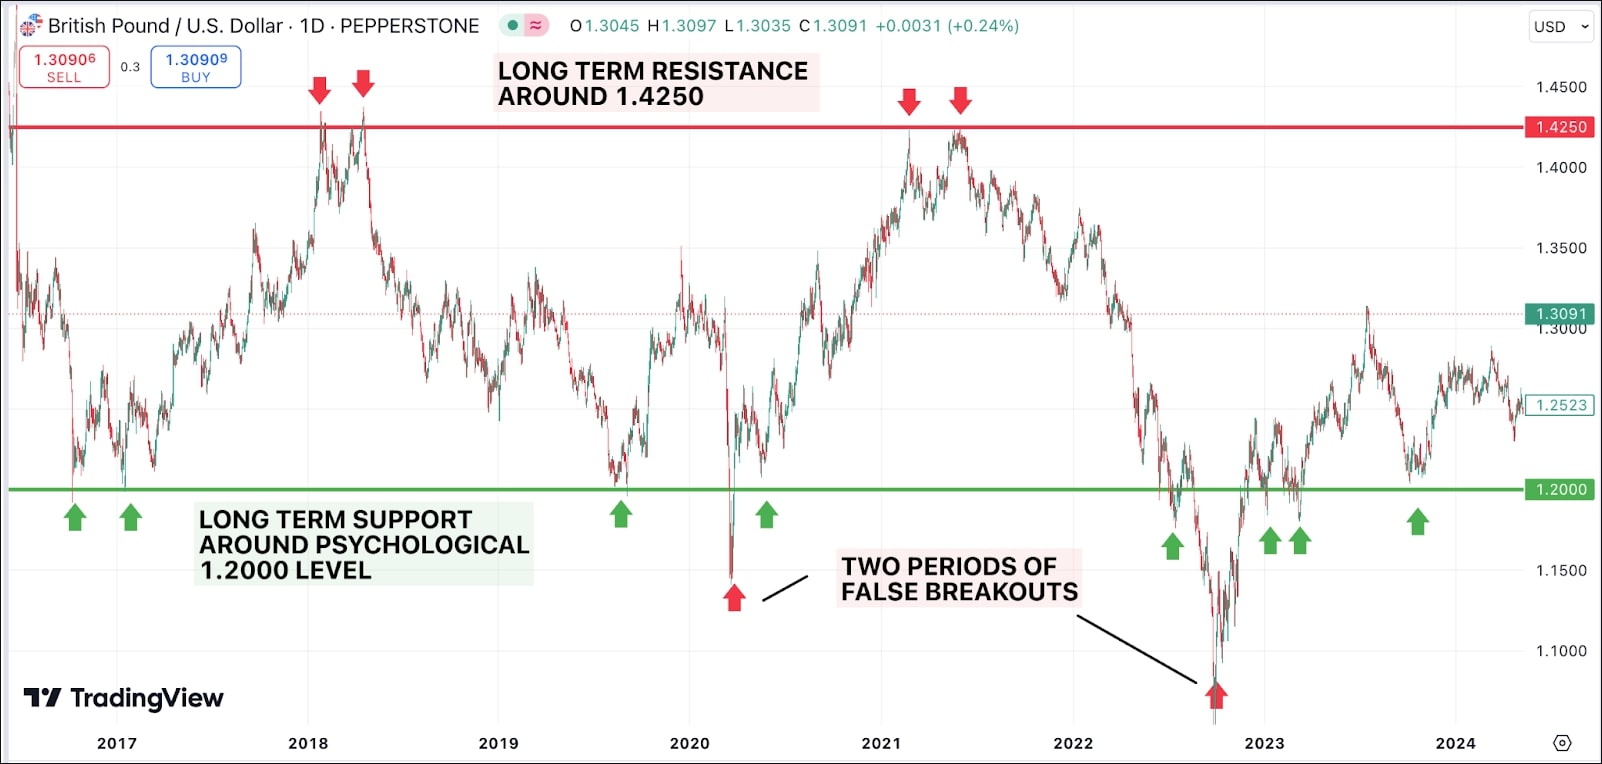
Historical levels give you an objective foundation and serve as the starting point for all further analysis.
2. Identifying Psychological Price Levels
Market participants often react around certain price numbers—even when the chart shows no previous technical levels.
These are known as psychological levels, commonly ending in:
- 00 (e.g., 1.3000)
- 50 (e.g., 1.3050)
- large whole numbers like 100, 500, and 1000 in indices or metals
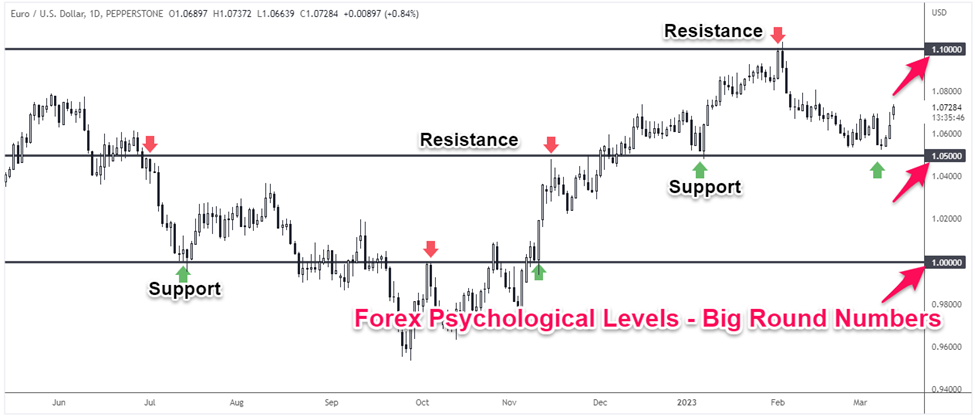
Why they matter:
- Many traders place orders around these round numbers.
- Institutional algorithms also reference them as liquidity clusters.
- They often act as “magnets” where price pauses or reacts.
Even without historical evidence, psychological levels often behave like natural S&R zones.
3. Using Technical Indicators for Dynamic Support and Resistance
Beyond static horizontal lines, markets also create dynamic S&R levels that move with price. Technical indicators help reveal these flexible boundaries.
Key dynamic tools:
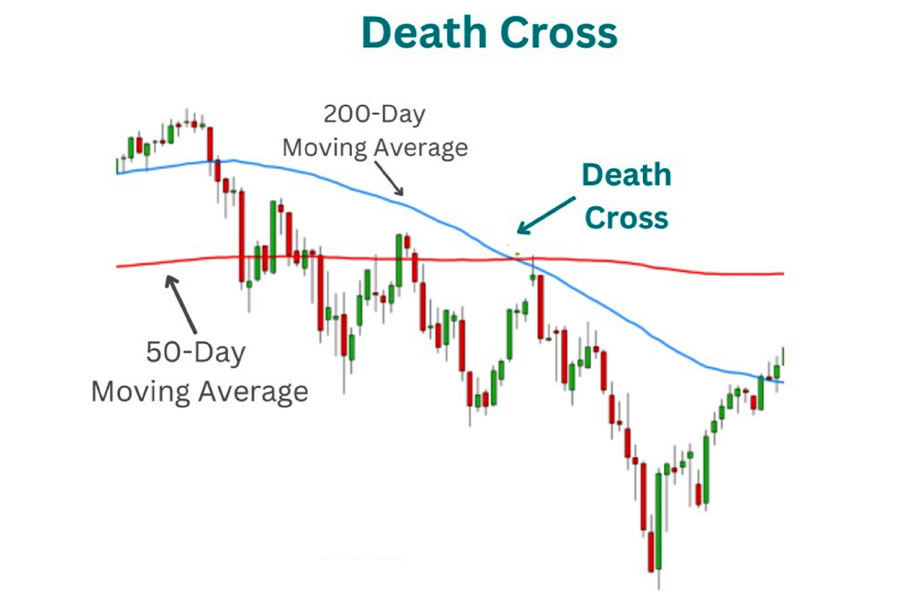
Moving Averages
Popular choices like the 50-day and 200-day moving averages often act as support during uptrends and resistance during downtrends.
Trend Lines
Drawn by connecting higher lows (support) or lower highs (resistance), trendlines form angled S&R zones that adapt to ongoing market structure.
Fibonacci Retracements
Important Fibonacci ratios—23.6%, 38.2%, 50%, 61.8%—help identify potential turning points after strong price movements.

Bollinger Bands
The upper and lower bands provide dynamic volatility-based boundaries that price frequently reacts to.
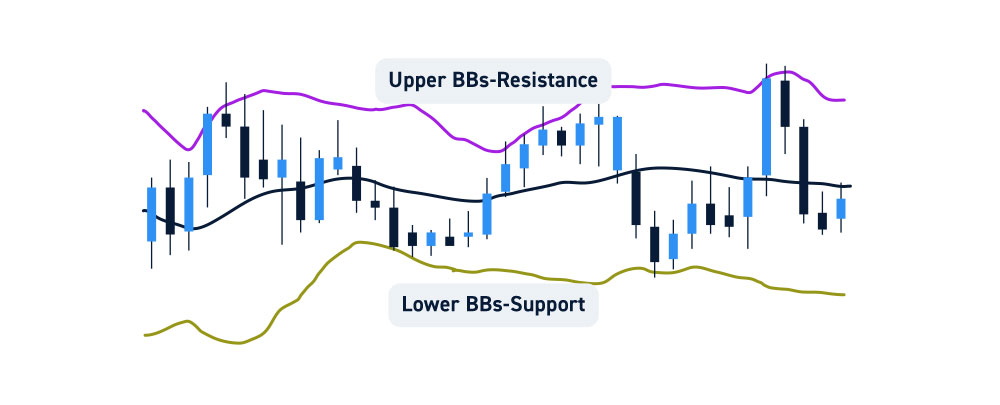
Dynamic S&R evolves with market behavior, offering context for developing trends.
4. Validating S&R Levels with Volume
Volume provides deeper insight into how strongly the market respects a level.
What to look for:
- High volume at an S&R zone
Suggests strong interest and higher probability that the level will hold—at least temporarily. - Low volume at an S&R zone
Implies weaker support or resistance and a greater chance of a breakout.

Volume helps distinguish meaningful levels from weaker ones and filters out false reactions.
5. Combining Multiple Methods for Stronger S&R
The most effective S&R levels are those supported by confluence—meaning multiple factors align at the same price zone.
Example of strong S&R confluence:
- A historical swing high
- Aligned with a psychological round number
- Sitting near a 50-day moving average
- Confirmed by increased volume
The more factors supporting a level, the more reliable it tends to be.
Using a layered approach helps reduce false signals and gives traders more confidence in evaluating market structure.
Common Visual Patterns You Would See on Charts
While no images are included here, typical examples include:
- Horizontal lines marking past swing highs/lows with strong reactions
- Price touching a moving average multiple times before reversing
- A Fibonacci retracement lining up with a trendline
- Volume spikes exactly at key levels
- Price repeatedly reacting at round numbers like 1.3000 or 1.3100
These patterns become more recognizable as you gain experience analyzing charts.
Quick Review
- Start with historical highs and lows to build static S&R levels.
- Add psychological levels to catch round-number reactions.
- Integrate dynamic S&R tools like moving averages, trendlines, and Fibonacci.
- Use volume to confirm the strength of each level.
- Combine methods to increase accuracy and reduce false signals.
Guiding Question
When you see price reacting strongly at a level with both high volume and a psychological round number, what does that suggest about the importance of that zone?
Reflect on this to strengthen your understanding before moving to the next lesson.
Conclusion: Building Reliable Support and Resistance Zones
Identifying Support and Resistance is both an art and a structured process. By blending historical analysis, psychological zones, dynamic indicators, and volume confirmation, you can pinpoint meaningful areas where price may react. This skill forms the backbone of technical analysis and will support more advanced concepts later in the course.
Mastering S&R identification equips traders with clearer insight into potential reaction zones, helping them interpret market structure with greater precision.
Next Step: Lesson 3 – Trading Strategies Around Support and Resistance
In the next lesson, we’ll explore how traders use S&R zones to plan entries, exits, stops, and overall market approach. You’ll learn how breakouts, retests, and bounce setups are formed and how these structures fit into broader market analysis.
People Also Ask:
What are Support and Resistance levels in trading?
Support levels are price zones where buying interest prevents further declines, while resistance levels are areas where selling pressure halts upward movements.
How do psychological price levels impact trading?
Psychological levels, such as round numbers (e.g., 1.3000), often act as natural magnets for price action due to trader behavior and institutional algorithms.
What role does volume play in validating S&R levels?
High volume at a level confirms its strength, indicating significant market interest, while low volume suggests weaker support or resistance zones.
Can dynamic indicators replace historical S&R levels?
Dynamic indicators like Moving Averages and Fibonacci Retracements complement historical levels but should be used in combination for greater accuracy.
Why is confluence important in identifying S&R zones?
Confluence strengthens S&R reliability by aligning multiple factors—historical data, psychological levels, indicators, and volume—for more accurate market analysis.