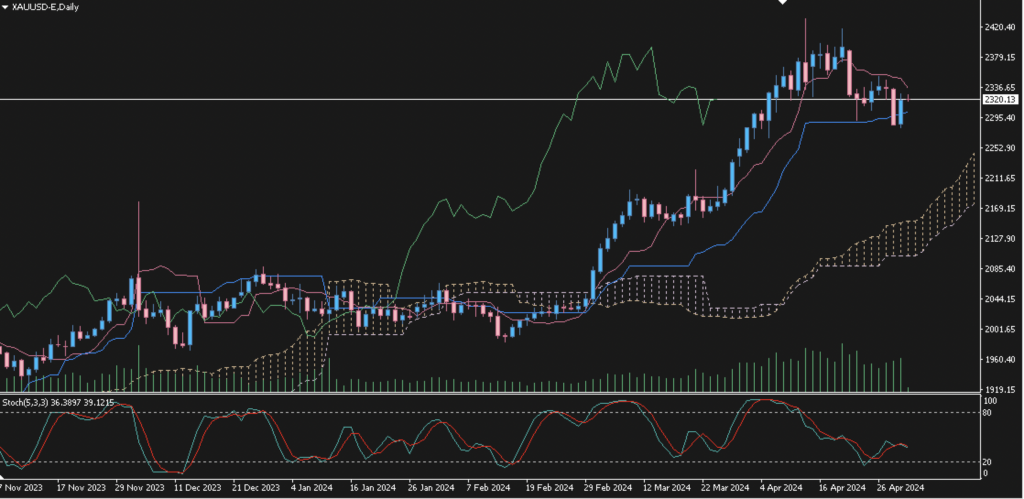
XAUUSD 2 May 2024 Analysis for XAUUSD on the daily timeframe shows that gold prices have been on the decline after hitting a high of 2392.17 in the middle of last month. However, the commodity is still well above the Kumo Cloud despite several trend changes. Currently, the Stochastic indicator is showing a declining graph towards the 20 level, signaling oversold or selling saturation. In addition, bearish signals are also visible on the candlestick chart, indicating a potential continuation of the price decline. Traders need to be aware of the possibility of a continuation of this bearish trend and look out for further confirmation in price movements before making trading decisions. Proper risk management is also necessary in the face of possibly volatile market conditions.


